Oversize Solar System NEM 3.0? What to Weigh

United States only. Last reviewed September 11, 2026. This page prints no peak sun hour figure for any state, on purpose.
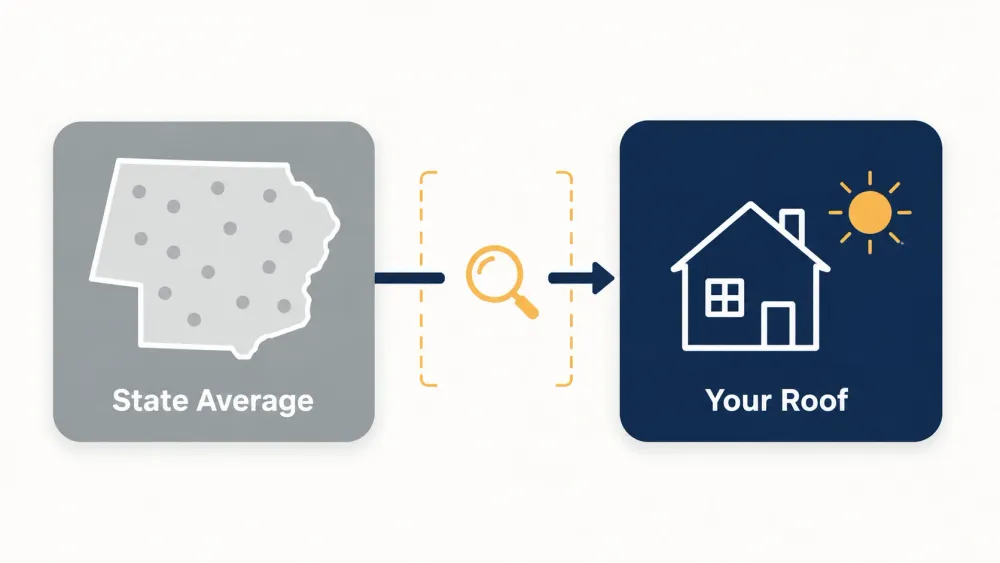
Peak sun hours by state tables give one average per state, and that average is the wrong input for sizing your system. A peak sun hour is one kilowatt-hour of sunlight landing on one square meter of surface. A state figure blends every location in the state, usually on a flat surface, over whatever years its publisher picked. What your system size actually needs is production per kilowatt at your address, on your roof's direction and tilt, and a free public tool gives you that number directly.
Living somewhere cloudy does not kill solar. It changes how many kilowatts it takes to produce a given amount of energy, and the rest of this page shows how to get that figure for your own house.
A peak sun hour is a unit of energy disguised as a unit of time.
Solar panels are rated under a standard test condition of 1,000 watts of sunlight per square meter. One hour at that intensity delivers 1,000 watt-hours, or one kilowatt-hour, per square meter. So a place described as getting a certain number of peak sun hours is receiving that many kilowatt-hours of sunlight per square meter per day, spread across however many hours of daylight it actually has.
That distinction matters because daylight and peak sun hours are different things. A long summer day contains far fewer peak sun hours than daylight hours, because morning and evening light is weak. A headline that says a state gets "plenty of sun" is usually talking about daylight. Your inverter is counting energy.
Search this phrase and you will find several tables, and they do not agree. The same state appears with different figures on different pages, and some pages give a single state a range several hours wide. There are four reasons, and none of them requires anyone to have made an error.
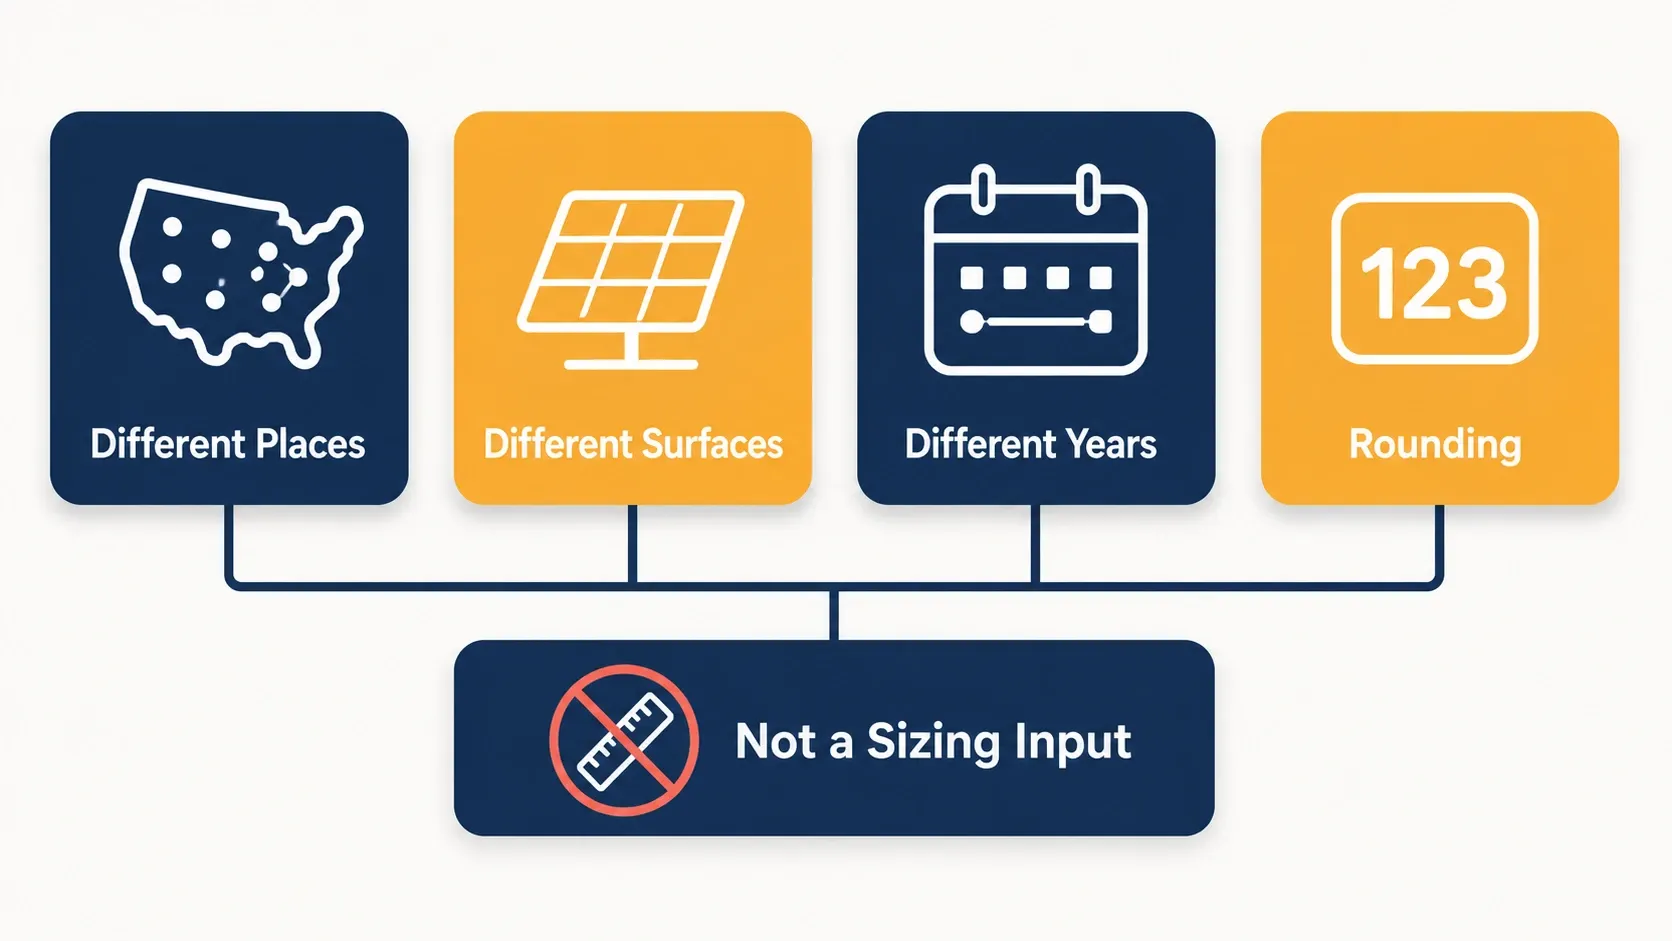
They average over very different places. A state can contain desert, mountains, coast and forest. One number for the whole state describes none of them.
They measure different surfaces. The simplest published figure is sunlight on a flat, horizontal surface. Your panels are tilted and pointed in a direction. Tilting toward the sun changes how much energy lands on each square meter, and the change differs by season and latitude. A table built on horizontal data is describing a roof you do not have.
They cover different years. Sunlight varies from year to year. A table built on one period differs from a table built on another, and most tables do not say which they used.
They round. A figure rounded to the nearest half hour moves your system size more than it looks, because it sits in the denominator of the sizing calculation.
The honest reading of any state table is "roughly this sunny, somewhere in this state, on a flat surface." That is fine for curiosity. It is not a sizing input.
The serious public source for US solar data is the National Solar Radiation Database. Its listing on the federal Open Energy Data Initiative, read on September 11, 2026, describes it as "a serially complete collection of meteorological and solar irradiance data sets for the United States and a growing list of international locations for 1998-2025," built on surface cells of roughly 4 km. It carries three measurements: global horizontal, direct normal and diffuse horizontal irradiance.
The database comes from the national lab that the Department of Energy renamed the National Laboratory of the Rockies in December 2025. It was previously the National Renewable Energy Laboratory, NREL, and a lot of older material still uses that name.
Two things follow. The data exists at a resolution of a few kilometers, not a state. And the lab already publishes a tool that turns it into a production estimate for a specific roof, so there is nothing to convert by hand.
Here is the whole relationship, without numbers.
Annual energy you want the system to produce, divided by annual production per kilowatt of capacity at your address, gives the system size in kilowatts.
Sunlight enters through the second term. Less sunlight means each kilowatt produces less over a year, so it takes more kilowatts to reach the same annual energy. More sunlight means fewer.
Three consequences are worth holding onto.
Whether solar pays in a cloudy place is decided far more by what you pay for electricity and what your utility pays for exports than by the sun. What your electricity rate does to the whole calculation is the first thing to check, and net metering rules that differ by state matter more than a fraction of an hour of sunlight.
The National Laboratory of the Rockies runs PVWatts, a free calculator that, according to its own page read on September 11, 2026, "estimates the energy production of grid-connected photovoltaic (PV) energy systems throughout the world." The lab's developer documentation lists the solar radiation database described above as its default weather data.
You give it an address, a system size, the roof's direction (azimuth, where 180 degrees means due south) and tilt, and an allowance for system losses. It returns estimated monthly and annual production. Enter a one-kilowatt system and the annual figure it returns is your production per kilowatt, which is exactly the term the sizing calculation needs.
Three features of the tool are worth knowing.
You do not need to go on your roof to get direction and tilt. An installer's proposal states both, and aerial imagery gives a close estimate of direction. Do not climb onto a roof to measure it. The CDC's occupational safety institute, NIOSH, states in an April 2026 bulletin that "falls from elevation remain the leading work-related cause of death in construction," and that is among people who are trained and equipped for the work.
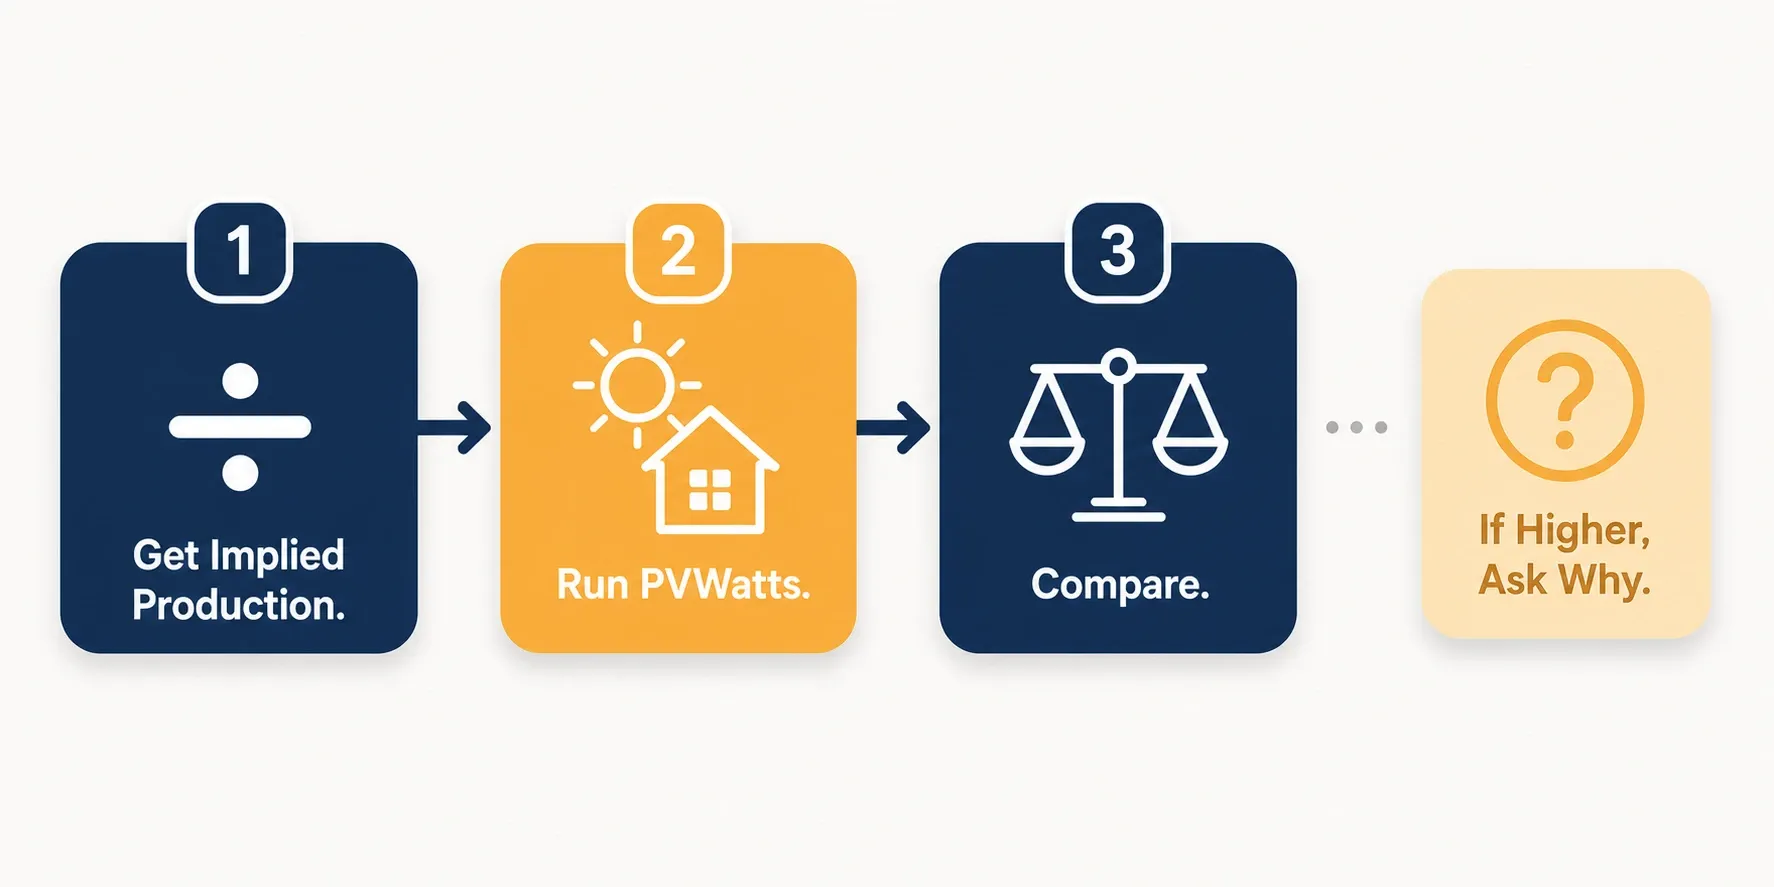
Every solar proposal contains a production estimate, and every production estimate contains a sunlight assumption. You can check it in an evening.
How to tell whether a production estimate is realistic walks through the other inputs in detail. When you have several proposals, putting them side by side on the same basis makes a generous sunlight assumption stand out quickly.
Low sunlight rarely decides the question on its own. It becomes decisive in combination with other things: a small or shaded roof that cannot fit the extra kilowatts, low electricity prices, or an export arrangement that pays little. The specific cases where solar does not pay are about those combinations, not about latitude alone.
The useful mental shift is this. A sunnier state does not make a given house a good candidate, and a cloudier one does not rule a house out. The roof, the rate and the export terms at that address do.
Why does this page not list peak sun hours for my state? Because a state figure is the wrong input for sizing, and the published tables disagree with each other. A state average blends very different places, is often measured on a flat surface rather than a tilted roof, and covers years the publisher may not name. The public calculator PVWatts, from the National Laboratory of the Rockies, gives production for your own address and roof, which replaces the peak sun hour step entirely.
Is a peak sun hour the same as an hour of sunshine? No. A peak sun hour is one kilowatt-hour of sunlight per square meter, the energy delivered by one hour at the 1,000 watts per square meter that panels are rated under. A day with many hours of daylight contains fewer peak sun hours than daylight hours, because early and late light is weak.
Do I need more panels if I live somewhere cloudy? Usually more kilowatts of capacity for the same annual energy, because each kilowatt produces less over a year. How many panels that means depends on the wattage of the panels offered. Whether the larger system fits your roof, and whether it pays on your electricity rate and export terms, are separate questions, and both are answerable for your specific house.
How accurate is PVWatts? Its own page describes its output as an estimate built on assumptions and uncertainties, and it reports a range based on 30 years of historical weather data to show year-to-year variation. It does not see your specific trees or equipment beyond what you enter. It is a reasonable independent check on a proposal, not a guarantee of output.
Peak sun hours are energy, not time: one kilowatt-hour of sunlight per square meter. State tables average over places, surfaces and years that are not your roof, which is why they disagree. System size is your annual energy target divided by production per kilowatt at your address, and PVWatts, run by the National Laboratory of the Rockies, gives that figure directly for your roof's direction and tilt. Use it to check every proposal's sunlight assumption, and let your electricity rate and export terms, not the sun alone, decide whether the system pays.
One email a week with new guides, tips, and solar news. Zero fluff, no sales pitch.