Do Solar Panels Need Cleaning? What 3 Makers Say

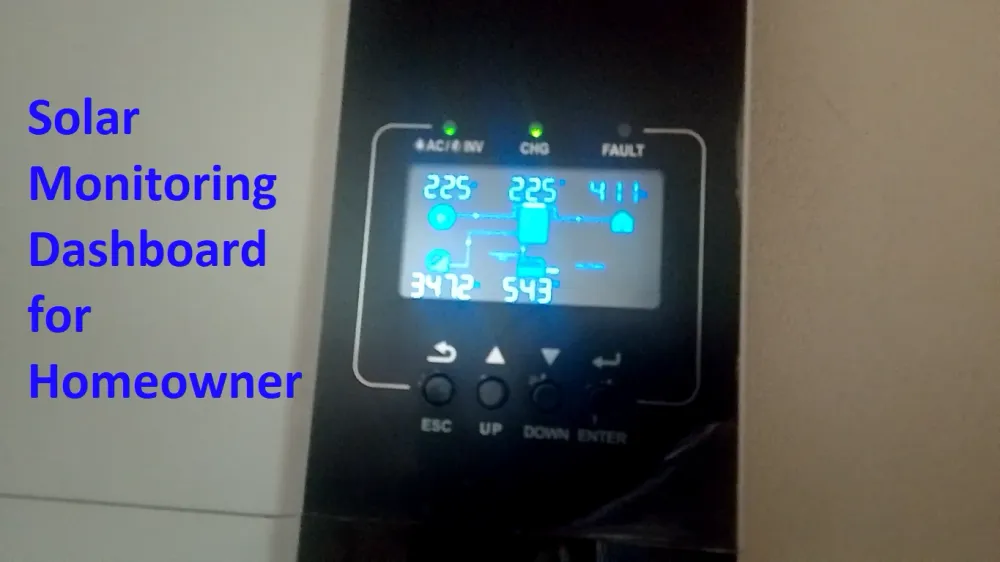
A solar monitoring dashboard for homeowners answers three questions and not many more: is the system generating right now, how much did it generate over a period you choose, and how does that period compare with the estimate in your signed proposal. It is a reporting tool before it is a diagnostic one. A single low day, a dip in the middle of the afternoon, or a gap in the chart is far more often weather, a refresh interval, or a dropped home internet connection than a broken system. Judge the system on months, not minutes.
Written for US homeowners with a grid-tied rooftop system. Nothing here involves going on a roof, opening equipment, or touching any wiring, and nothing here should.
Two units do most of the work, and mixing them up causes most of the panic.
Kilowatts (kW) are a rate: the power the system is making at the instant the app last updated. Kilowatt-hours (kWh) are a quantity: the energy produced over a span of time. Your utility bills you in kilowatt-hours, your proposal estimated kilowatt-hours per year, and your production guarantee, if you have one, is written in kilowatt-hours. So the number that matters for every money question is the kWh total, and the live kW figure is mostly entertainment.
The second distinction is production versus consumption. Every system reports production, because the equipment making the power is also counting it. Consumption is different: showing how much your house used, and therefore how much you imported from the grid or exported to it, requires separate metering hardware on the main service. If your app shows no consumption data, that is usually a sign that this hardware was not part of the install rather than a sign that anything failed. Your utility bill is the authority on imports and exports in any case, and how net metering works decides what those exports are worth to you.
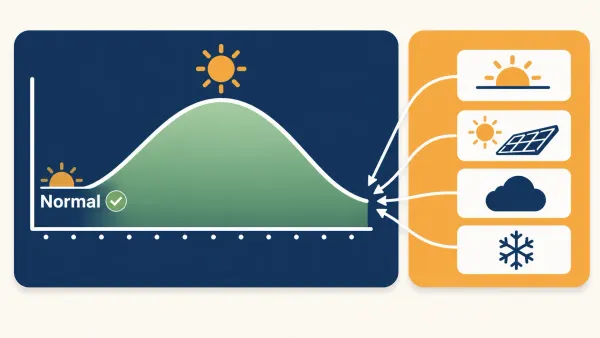
A clear day produces a rounded curve: output climbs after sunrise, peaks somewhere near the middle of the solar day, and falls away toward sunset. Cloud cover turns that curve into a jagged line because irradiance is genuinely jumping up and down. Neither is a fault.
Two shapes are worth understanding before they alarm you.
A flat top, where output rises to a ceiling and stays there for hours before falling, usually means the array can briefly produce more DC power than the conversion equipment is rated to pass through to AC. Systems are commonly designed this way on purpose, because the ceiling is only reached in a handful of hours a year and paying for larger conversion equipment to capture them rarely makes sense. If you want to know whether that was a deliberate design choice in your case, the answer is in the proposal and the installer can explain it.
A notch, where output drops sharply at the same time of day and then recovers, is the signature of a shadow crossing the array. It tends to appear or deepen as trees grow and as the sun sits lower through autumn. Our guide to solar panels and shade trees covers how much shade actually costs you and what can be done about it.
This is where most of the anxiety comes from, because the app looks authoritative and is silent about its own limits.
It cannot tell you whether your production is good. It can only tell you what your production was. "Good" is defined by one document, the estimated annual production printed in the proposal you signed, which was modeled for your address, roof pitch, orientation, and shading. The Department of Energy's homeowner's guide to going solar points homeowners at the National Renewable Energy Laboratory's PVWatts tool for exactly this reason, noting that it "estimates the energy production and cost of energy of grid-connected PV energy systems for any address in the world." A modeled, site-specific annual figure is a benchmark. A neighbor's output, a panel's nameplate wattage, or last month's total is not.
It cannot reliably tell you that something is broken. Monitoring depends on a communications device in your house and on your home internet. When that link drops, the chart shows zeros or gaps while the system goes on generating perfectly well. The way to tell the two apart costs nothing: look at your utility bill or your utility's own usage portal for the period the app shows as missing. If the meter recorded exports, generation continued and you have a reporting problem, not a production problem.
It is also not a real-time feed. Platforms update on an interval and display the timestamp of the last update somewhere on the screen. Reading a number that is older than you assume, and concluding the system has stopped, is a common and entirely avoidable scare.
Treat the dashboard as a record keeper rather than an alarm system. Three figures do nearly all the useful work.
| Reading | Where it comes from | What it is good for |
|---|---|---|
| Monthly production, in kWh | The app's monthly or calendar view | Comparing the same month across years, and summing a full year |
| Twelve-month total, in kWh | The app's annual view, or twelve monthly figures added | The only fair comparison against the proposal's estimated annual production |
| Dates of gaps and zeros | The daily view | Separating reporting outages from generation outages later |
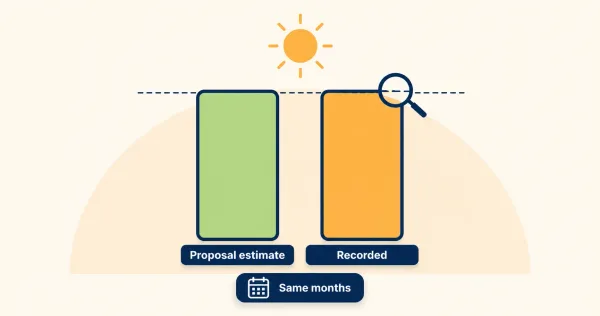
A twelve-month total is the comparison that counts, because weather years differ and any single month can be unrepresentative. If the twelve-month total lands close to the modeled estimate, the system is doing what it was sold to do even if three individual months looked disappointing. If it falls meaningfully short and the shortfall repeats in a second year, you have something concrete to raise. Whether the estimate itself was realistic is a separate question, and our guide on whether a production estimate is realistic covers the inputs that move it.
Call your installer, not a search engine, when any of the following holds for more than a few days and is not explained by weather, snow cover, or a known internet outage:
What not to do is as important. Do not go up to look. Do not open, reset, or power cycle equipment on the strength of a forum post. Diagnosing the device itself is the installer's job and, where the work touches wiring, it is legally a licensed electrician's job.
This is the part the vendor tutorials skip, and it is the part that decides how a dispute ends. A monitoring record is the primary evidence in a production guarantee or workmanship conversation, so collect it in the form someone else can check.
Export or screenshot the monthly production table rather than describing it. Note the exact dates of any gap. Put the proposal's estimated annual production on the same page as your actual twelve-month total so the comparison is explicit. Keep the system's commissioning date, because warranty terms run from it.
Then read what you are entitled to. The Federal Trade Commission's guidance on solar power for your home tells buyers to confirm "the minimum power the provider says a system will produce, and what happens if the system doesn't produce that amount." If your contract contains that clause, the dashboard is how you invoke it, and the six clauses that decide a production guarantee is where to look at the wording before you make the call.
Why does my app show a lower number than my utility bill? They measure different things. The app reports what the system generated. The bill reports what crossed the utility meter, which is generation minus whatever your house consumed on site at the time. On a system without consumption metering, the two will never match, and they are not supposed to.
Is it normal for the app to go offline? Communication dropouts are common, because the chain runs through your home router. The system usually keeps generating through them and backfills some data when the link returns. Treat a gap as a reporting question first, and confirm it against your utility's usage data before treating it as a fault.
How often should I check it? Monthly is enough for anything that matters, with a glance after severe weather. Daily checking produces a lot of false alarms, because a cloudy Tuesday looks exactly like a problem if you have nothing to compare it with.
Does panel-level data mean I can spot a bad panel myself? Systems with per-panel reporting show one module reading differently from its neighbors, which is genuinely useful information to pass on. It is not a diagnosis. Differences in tilt, soiling, and shadow all produce the same pattern, and deciding what it means is the installer's call.
What should I keep if I sell the house? Keep the production history, the proposal, the commissioning date, and the warranty documents together. Buyers and their lenders ask for exactly those, and a system with a clean, exportable production record is easier to explain than one with twelve months of screenshots on a phone.
One email a week with new guides, tips, and solar news. Zero fluff, no sales pitch.