Do Solar Panels Need Cleaning? What 3 Makers Say

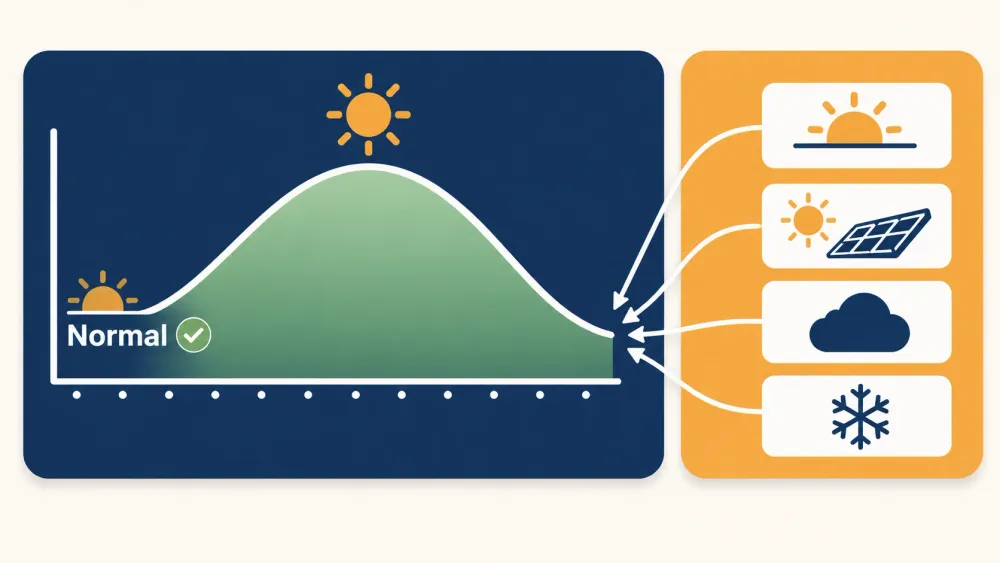
Solar production in winter is lower than in summer on every grid-tied rooftop in the United States, and a large drop in December is the normal condition rather than a fault. Shorter days, a lower sun angle, heavier cloud, and snow cover all push the same direction at once. What no honest page can give you is a single percentage, because the size of the swing depends on your latitude, roof pitch, orientation, and local climate. The number that applies to your house is in your proposal's month by month estimate, and this page explains how to read it.
Written for US homeowners with a grid-tied rooftop system. No figure appears on this page without a named source, and no roof work of any kind is described.
Three things change between July and December, and none of them is about the equipment.
The length of the day. The National Weather Service explains that seasons exist because "the Earth is tilted on its axis by 23.5°" and that "the Northern Hemisphere is tilted toward the sun in June and away from the sun in December," which is why the solstices mark the longest and shortest days of the year. Fewer hours of daylight means fewer hours in which anything can be generated at all, before a single cloud is considered.
The height of the sun at midday. The same tilt that shortens the day also keeps the sun lower above the horizon through winter. Light then arrives at a sharper angle to a fixed roof plane and travels through more atmosphere to get there. The Energy Information Administration puts the first half plainly: photovoltaic "cells and panels produce the most electricity when they are directly facing the sun," and most residential systems are fixed at one compromise angle rather than tracking it.
Weather and cover. Winter brings more cloud in most of the country, and in snow country it brings periods when the array is covered and producing nothing at all. Snow slides or melts off tilted glass on its own in time, and that time is part of your winter total.
A fourth factor cuts the other way and is smaller than people hope. Cold improves a cell's electrical behavior: the Department of Energy notes that higher temperatures produce "a slight increase in current, but a much larger decrease in voltage," which means cool conditions are electrically favorable. A bright, freezing day can produce impressively for its length. It is still a short day with a low sun, and that is what decides the month.
Search results for this question are full of confident numbers. Most of them are published by companies selling installation or service, almost none name a source, and the ones that do are usually describing a single state or a single system.
The swing genuinely varies with:
Any one of those can move the result more than the difference between two published averages. A national percentage applied to your roof is a guess wearing a decimal point.
You have a modeled answer already, and it is specific to your address.
The proposal. Most residential proposals include a month by month production estimate, not only an annual figure. That table is the forecast you were sold on, and December in that table is your benchmark for December. If your copy shows only the annual number, ask the installer for the monthly breakdown behind it. They have it, because the model produced it.
A site-specific model. The Department of Energy's homeowner's guide to going solar points at the National Renewable Energy Laboratory's PVWatts tool, which "estimates the energy production and cost of energy of grid-connected PV energy systems for any address in the world." Run with your own address, array size, tilt, and azimuth, it returns estimated output month by month. Treat it as a sanity check on the proposal rather than a verdict, and expect weather in any single year to differ from a long-run model. Whether the proposal's inputs were realistic in the first place is a separate question, covered in is your solar production estimate realistic, and a national table of peak sun hours by state is useful for intuition and useless as a personal benchmark.
Seasonal decline and a genuine fault look similar for a week and look nothing alike over a year. Four comparisons separate them, and all four use data you already have.
| Comparison | What a normal winter looks like | What a problem looks like |
|---|---|---|
| This December against the proposal's December | Close, or explained by an unusually cloudy or snowy month | Far below, with ordinary weather |
| This December against last December | Similar, allowing for weather | Clearly lower with no new shade and no snow on the glass |
| The daily curve on a clear winter day | A smaller, narrower version of the summer curve, same rounded shape | Flat, zero, or chopped off part way through |
| The twelve month total against the modeled annual | Within the range you would expect from one weather year | Short two years running |
The last row is the one that carries weight in a conversation with an installer, because a full year absorbs the seasons. A shortfall that survives twelve months is worth raising; a bad two weeks in January is not.
Leave it alone. Clearing snow from a roof mounted array means height, ice, and glass, which is the combination that sends people to hospital, and aggressive clearing can damage the modules and the coating. Panels are dark and tilted and shed snow as the weather turns. The production you lose while covered is a known and accepted part of winter output in every snowy state, and it is already inside the modeled monthly estimate for your location.
A grid-tied system without a battery does not store summer sunshine for January. What can carry value across the seasons is your utility's billing arrangement. Under a traditional net metering arrangement, credits earned in surplus months can offset deficit months within the billing year, which is why a winter bill can arrive even on a system that is performing exactly as modeled. The rules, the credit rate, and the length of the banking period are set by your state and your utility, so the answer to "why am I paying in February" is in your tariff rather than in your panels.
Is it normal for winter production to be less than half of summer? In much of the country a drop of that order is unremarkable, and in northern states it can be larger still. The reason to check your own modeled monthly figures rather than accept a rule of thumb is that the honest answer ranges widely by latitude, pitch, and climate, and a single national number is wrong for most houses that read it.
Do solar panels work on cloudy days? Yes, at reduced output. Diffuse light still reaches the array, which is why a bright overcast day registers clearly on the production curve while a dark storm barely does.
Should I change my panel angle for winter? Fixed residential arrays are not designed to be adjusted, and nobody should be on a roof adjusting them. Tilt is a design decision made once, trading summer output against winter output, and the time to discuss it is before installation.
My system produced nothing for three days in January. Is that a fault? Check for snow cover first, then check whether your monitoring simply lost its connection, which is a reporting gap rather than a production gap. If clear days are producing zero and nothing is covering the glass, that is the point to contact the installer.
Does the annual estimate in my proposal already include winter? It should. An estimated annual production figure is the sum of modeled monthly output across a full year, winter included. That is why the twelve month total, not a single month, is the fair test of whether the system is meeting what was sold.
One email a week with new guides, tips, and solar news. Zero fluff, no sales pitch.